 Ionization Potential chart
by Steve Waterman For elements 1-30, with up tp 18 ionization levels. 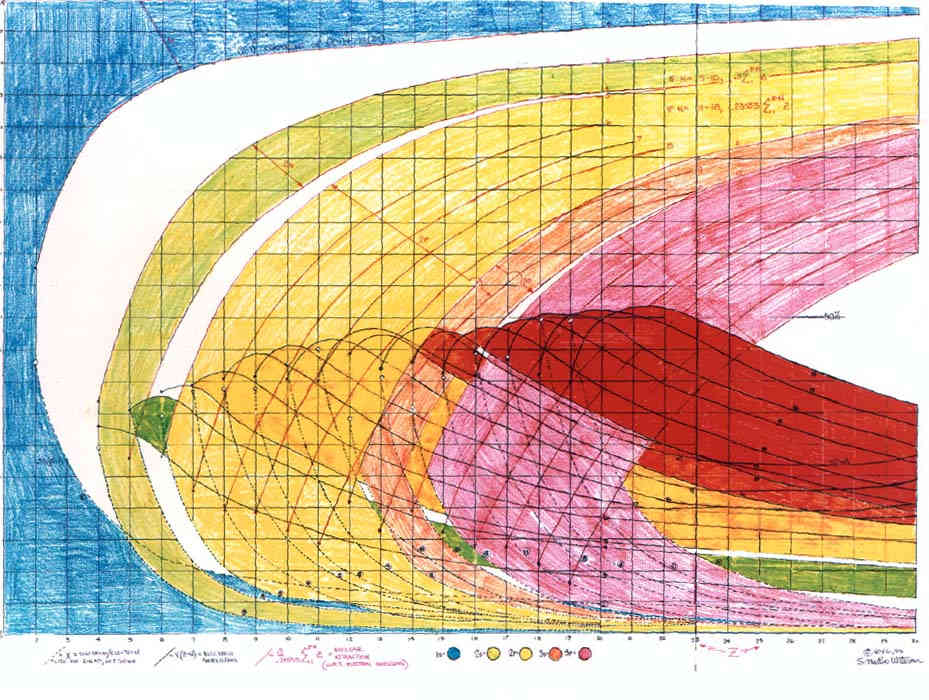 red lines = nuclear attraction
black lines = electron sheilding dotted black lines = electron/electron colored in sections... blue 1s green 2s yellow 2p orange 3s red 3p The proton value then, is represented by the red line under the blue section.  As viewed currently Physics. The derivation of the following formula and following chart from Mathworld: Isoperimetric Quotient   My connection with the fine structure value.
|